Using the LMOP National Map
On this page:
- How to Use the Map
- Basic Map Functionality
- EJScreen and Tribal Areas
- Identifying Communities with Potential EJ Concerns
- Example Results When Using the LMOP Map
How to Use the Map When Considering Environmental Justice in Landfill Gas Energy Project Development
The LMOP national map can be used for various purposes, including to identify areas where landfill gas (LFG) energy project development may warrant additional consideration, analysis or outreach to surrounding communities. This page provides instructions for how the map could be used when considering potential environmental justice (EJ) concerns during LFG energy project planning and development.
The LMOP map includes data from the LMOP Landfill and LFG Energy Project Database (LMOP Database), EPA’s Environmental Justice Screening and Mapping Tool (EJScreen) and EPA Tribal land datasets.
Basic Map Functionality
The map’s default view displays operational LFG energy project locations in the continental United States, Puerto Rico and the U.S. Virgin Islands. To include Alaska and Hawaii in the frame, use the minus symbol in the upper left corner of the map to zoom out. To zoom into an area of the map, use the plus symbol in the upper left corner of the map. You can also zoom in and out by using a mouse or track pad.
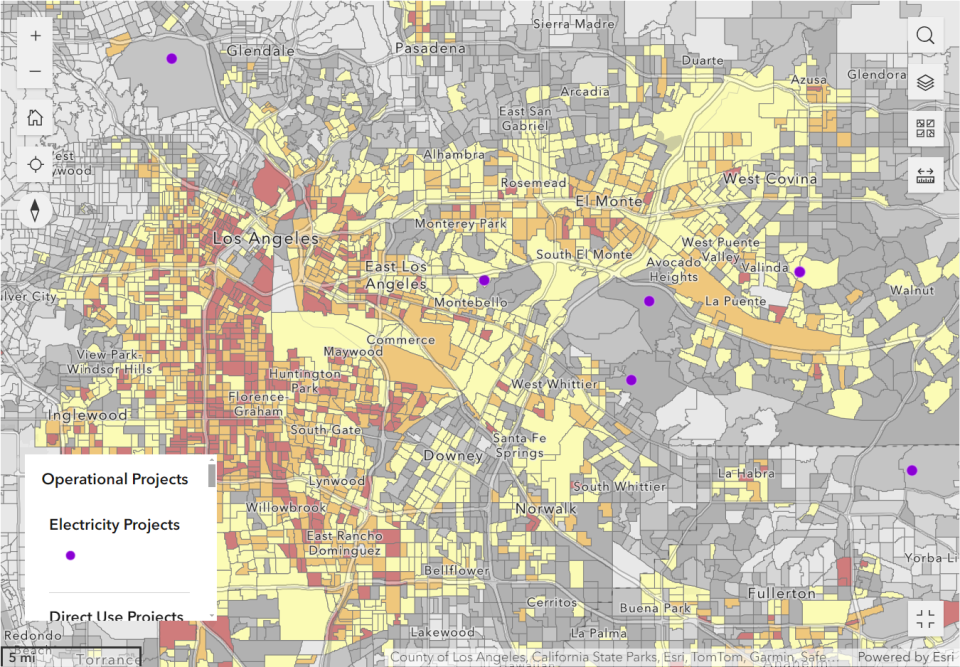
As shown in the legend at the bottom left corner of the map, operational project locations are shown as circles color-coded by end-use category: purple for electricity projects; teal for direct-use projects; olive green for renewable natural gas (RNG) pipeline-injection projects; and black for RNG local use projects. Learn more about LFG energy project types.
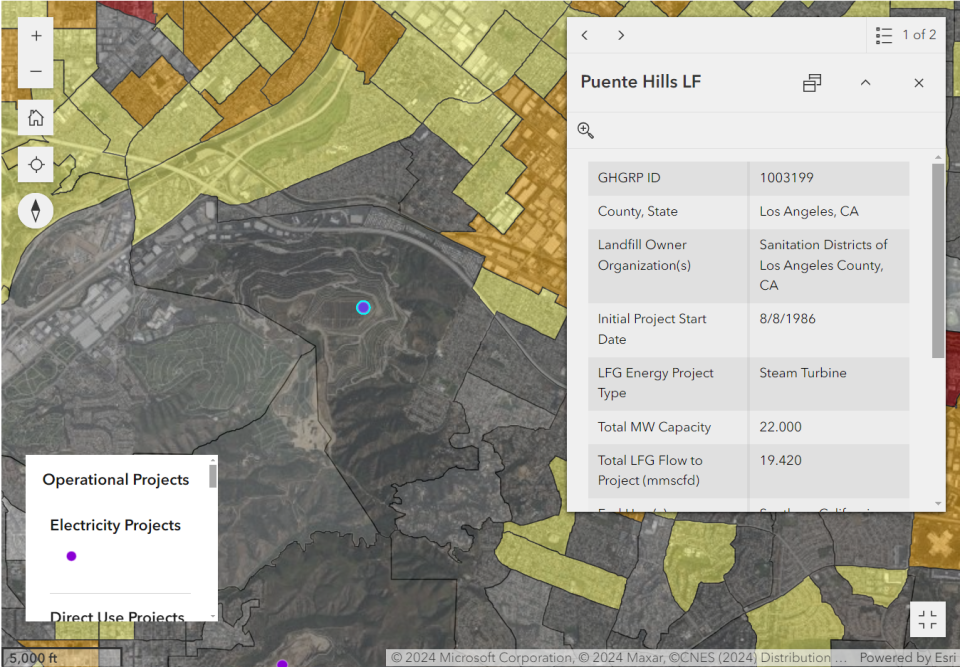
To view data for any operational project, click on its circle. A pop-up box will list basic information including the landfill name, project start date, energy equipment type, project size and involved entities, as shown in Figure 1.
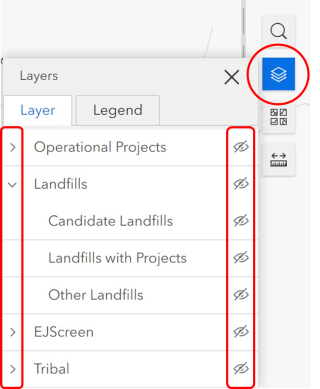
To adjust the data layers displayed on the map, click the stacked paper icon near the top right and click on an eye (Visibility symbol) to show or hide a layer. Click on the greater-than symbol to the left of each main layer to display (expand) sub-layer options. Figure 2 shows a portion of the Layers menu.
The map includes data for active and closed municipal solid waste landfills, including owner organization, open and closure years, design capacity, amount of waste in place, gas collection system status and amount of LFG collected. Both landfills and projects can be displayed on the map at the same time, or just one of these layers.
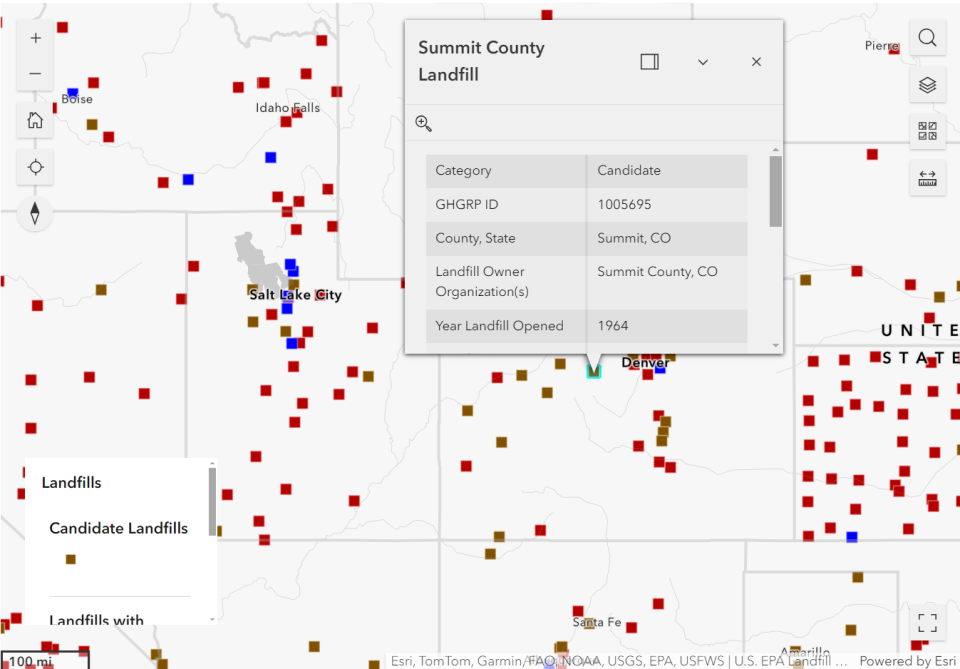
As shown in the legend at the bottom left corner, landfill locations are shown as squares color-coded by groups: brown for candidate landfills; blue for landfills with an operational, under-construction or planned project; and red for other landfills not in the first two groups. Learn more about project status definitions within the LMOP Database.
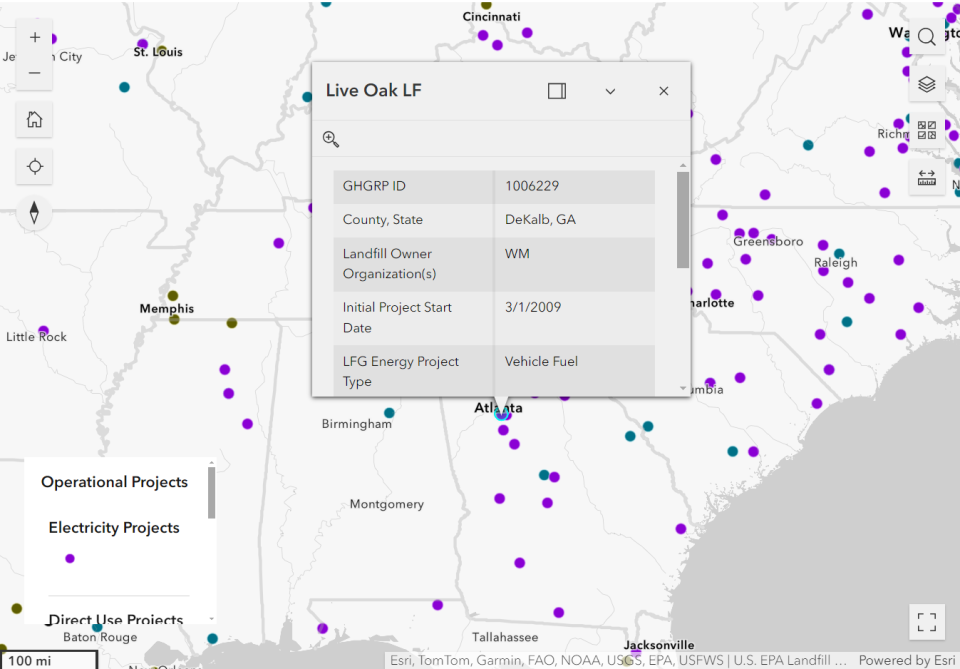
To view data for any landfill, click on its square to display a pop-up box, as shown in Figure 3.
EJScreen and Tribal Areas
EJScreen can be used as a preliminary screening step when considering EJ in certain situations. The LMOP map includes the following seven demographic indicators and two demographic indexes from EJScreen, which can be used to highlight census block groupsThe standard unit of analysis in EJScreen is the Census "block group”, an area defined by the Census Bureau that usually has 600 to 3,000 people living in it. The United States is divided into more than 230,000 block groups. Block group resolution is the finest level of detail at which Census data can be publicly shared. that may have potentially vulnerable populations:
- People of color
- Low-income
- Unemployment rate
- Limited English speaking
- Less than high school education
- Under age 5
- Over age 64
- Demographic Index, based on the average of two indicators (people of color and low-income)
- Supplemental Demographic Index, based on the average of five indicators (low-income, unemployment rate, limited English speaking, less than high school education and low life expectancy [a health dataset])
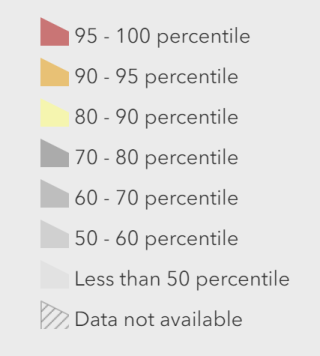
In the LMOP map, each EJScreen index or indicator is displayed as a national percentile that shows how local residents compare to everyone else in the country. A national percentile represents what percent of the U.S. population lives in a block group with an equal or lesser value for that indicator/index. For example, for a block group at the 80th percentile nationwide, that means 80 percent of the U.S. population has a lesser (or equal) value of the given indicator or index. The categories are displayed using color-coded percentile bins, similar to those shown in Figure 4.
The LMOP map also provides layers for Tribal Lands & Indigenous Areas; Other Indigenous Areas; and State Designated Tribal Statistical Areas from EPA’s EnviroMapper for Envirofacts. These EPA Tribal land data are displayed as ten data layer options. Some are area layers while others (Alaska Native Villages, Virginia Federally Recognized Tribes) are point locations.
The data layers from EJScreen and the Tribal land data are accessible via the stacked paper icon near the top right. Click on the eye beside “EJScreen” and “Tribal” to show or hide these layers and click on the greater-than symbol to the left of each main layer to display the sub-layers (many of the sub-layers do not show by default). EJScreen layers and/or Tribal land data can be displayed on the map at the same time as landfills, projects or both.
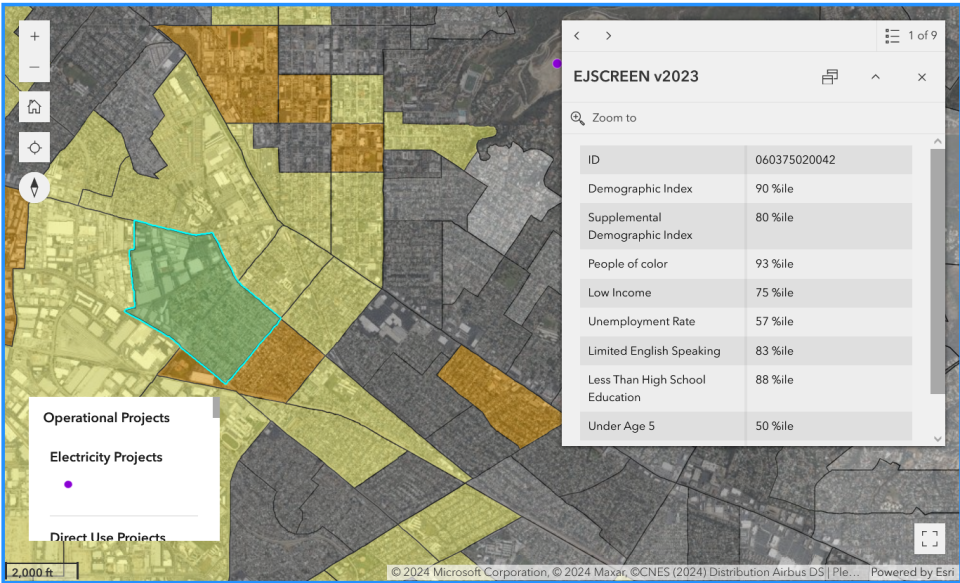
To view EJScreen layers on the map, you must zoom into an area of the map at the state level or closer. To view details for an EJScreen block group or a Tribal land area, click on the group or area of interest to display a pop-up box (Figure 5). In EJScreen, higher percentiles mean the area has a higher percent of people for that indicator as compared to other areas of the United States.
Identifying Communities with Potential EJ Concerns
There are not definitive, one-size-fits-all criteria for identifying if a landfill is near a community with potential EJ concerns, but one option to begin the screening process is to locate block group(s) with a Demographic Index or Supplemental Demographic Index at or above the 80th percentile within a specific radius of interest around a landfill (for example, with a radius of 1 mile or 5 miles). High percentiles indicate relatively uncommon values. However, these values may not translate into health or legal concerns, so screening results should be supplemented with additional information and local knowledge to increase understanding of the issues in a selected location. Additional analysis may be required to ascertain if these are communities with EJ concerns and could include:
- Examining available environmental data and comparing it to health-based and legal thresholds to identify any health or related impacts to the community; and
- Determining the degree of disparity between these communities and nearby communities with respect to exposure to environmental pollutants.
To determine area-specific percentiles for pollution, health and other factors in addition to demographics, visit the EJScreen website. After launching the tool, enter the landfill’s address or latitude/longitude coordinates in the search bar at the top right (these can be obtained from the LMOP Database but may need to be verified as LMOP cannot guarantee all location data are accurate). Change the basemap to show aerial imagery using the icon at the bottom left of the map and adjust the map to show the landfill, if needed. Use the “Reports” widget (piece of paper icon) at the upper left to:
- “Drop a Pin” to select the landfill as a point;
- “Draw an Area” to trace around a whole site or area of interest;
- “Select Block Group” to select the whole block group in which the landfill is located; or
- Make a different type of selection.
When you select a geographic point or area, a pop-up will appear for the selection. For Pin or Area, you can draw a buffer of any size around the selection (a circle around the point or a buffer around the edge of the area). For Block Group, click on the map near the landfill to select one or more block groups.
Click the EJScreen Community Report link in the same pop-up to open a report with environmental and socioeconomic information for your defined area, whether it is a circle around a single point or a selected area, buffered location, or block group(s). The EJScreen Community Report results can help identify whether an area may warrant further consideration, analysis or outreach.
LMOP chose layers for national indicators and indexes for the LMOP map, but EJScreen also includes state-based percentiles for a more in-depth analysis. You can use the state-based percentiles within EJScreen to see how a locality compares to other communities within that state.
Use the Help link at the upper right corner of the EJScreen webpage for additional information on how to use this tool.
Example Results When Using the LMOP Map
The following images show various results when using the LMOP national map.