
Power Plant Environmental Justice Screening Methodology
EPA’s Power Plant Environmental Justice Screening Methodology incorporates several peer-reviewed approaches that combine air quality modeling with environmental burden and population characteristics data to:
- Identify and connect power plants to geographic areas potentially exposed to air pollution by those power plants.
- Quantify the relative potential for environmental justice concern in those areas.
This information enables EPA to provide a screening-level look at the relative potential for power plants to affect areas of potential EJ concern and is categorized into two main efforts.
Identifying Areas Exposed to Air Pollution from Individual Power Plants
To identify the areas (census block groups) potentially affected by air pollution from each power plant, we look at a range of distances from each power plant, informed by modeling that estimates where air pollution travels. EPA uses two different models to estimate the range of different types of pollutants:
- For air pollutants in the vicinity of each power plant (like toxics), EPA uses AERMOD to estimate distances at which pollution concentrations likely begin to diminish. For each power plant, this provides different distances that can be used to identify census block groups that might be exposed to these pollutants.
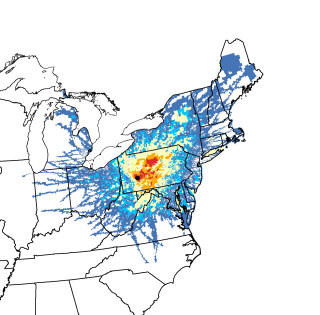
- For other air pollutants, which can travel much further, EPA uses HYSPLIT to estimate the various pathways the pollutants can take over a 24-hour period. This allows us to identify the census block groups that might be exposed to pollution from each power plant and estimate the relative potential for exposure.
Each of these approaches uses air quality modeling combined with GIS analysis to identify census block groups that are potentially exposed to air pollution from each of the power plants.
Identifying Areas of Potential EJ Concern
EPA also identified areas of potential EJ concern within areas that are potentially exposed. To identify which areas of the country might have EJ concerns, and the relative extent of those potential concerns, we look at several different indicators of environmental burden and population characteristics of census block groups across the U.S. Combining this information in different ways helps us approach this from two different perspectives:
- A cumulative impact perspective, which considers the extent of existing pollution burden and social vulnerability to that pollution.
- A social vulnerability perspective, which focuses solely on potential social vulnerability regardless of the amount of potential environmental burden.
Quantification of cumulative impacts and social vulnerability are areas of active research, so this methodology should be viewed as an initial effort to evaluate these concepts to allow relative comparisons nationally at a census block group resolution.
Potential Uses: Power Plant Screening
One application is to combine this information in a way that screens power plants based on the relative potential for EJ concern in the areas exposed to air pollution by each plant.
For example, we developed two potential EJ scoring approaches that can be used to rank power plants. The first method screens power plants based on their potential to affect the greatest number of overburdened people. This considers how many people are potentially exposed to air pollution by each plant, and the current extent to which those people are both exposed to pollution and vulnerable to pollution exposure. The second method screens the plants based on the potential to affect the most vulnerable people on average. This considers the social vulnerability of the average person living in an area that has the potential to be exposed to air pollution by each plant.
Documentation
For more information about the Power Plant Environmental Justice Screening Methodology and the June 2023 peer review process:
- Power Plant Environmental Justice Screening Methodology Peer Review Report (pdf)
- EPA responded to comments developed through the peer review process:
Responses to Peer Review (pdf) - This documentation contains detailed information about the technical and analytical considerations that informed the development of PPSM:
Screening Ranking Documentation Draft (pdf)
- Appendix I (xlsx) includes scores for each power plant included in the peer-reviewed methodology:
- Appendix II (xlsx) includes all the power plants in the peer-reviewed methodology: